MAKE A MEME
View Large Image

| View Original: | 10-cube column graph.svg (606x530) | |||
| Download: | Original | Medium | Small | Thumb |
| Courtesy of: | commons.wikimedia.org | More Like This | ||
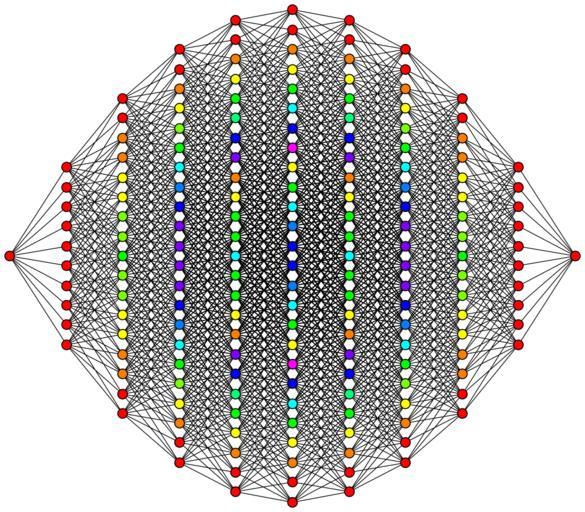
| Keywords: 10-cube column graph.svg 10-hypercube 10-cube graph This hypercube graph is an orthogonal projection This oriented projection shows columns of vertices positioned a vertex-edge-vertex distance from one vertex on the left to one vertex on the right and edges attaching adjacent columns of vertices The number of vertices in each column represents rows in Pascal's triangle being 1 10 45 120 210 252 210 120 45 10 1 in the case of this 10-cube Note Starting with the tesseract the orthogonal projection shows vertices overlapping The counts of vertices at each 2d location are represented by colors red orange yellow green etc own Geoff Richards Qef 2008-07-23 Old bitmap version en Image 10-cube_column_graph gif Source code See en User Qef/Orthographic hypercube diagrams Qef Hypercube graphs 2-fold rotational symmetry Geometry images with dihedral symmetry 02 | ||||