MAKE A MEME
View Large Image
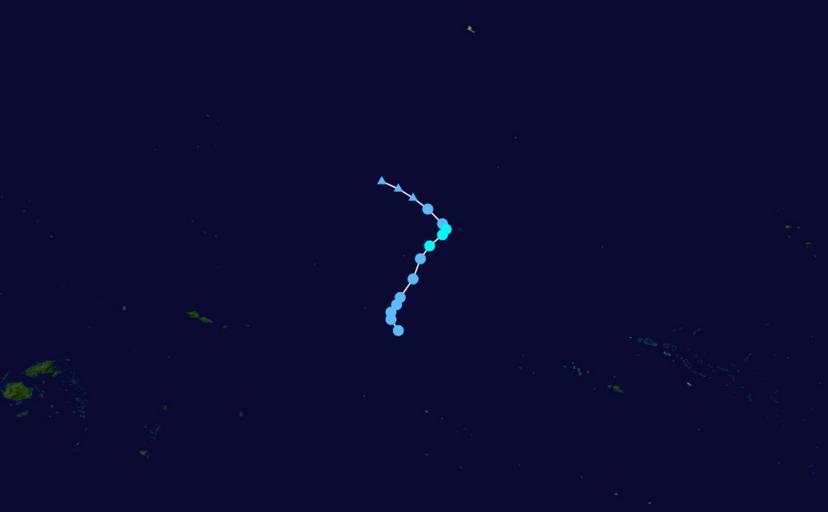
| View Original: | 11F 2010 track.png (1024x633) | |||
| Download: | Original | Medium | Small | Thumb |
| Courtesy of: | commons.wikimedia.org | More Like This | ||
| Keywords: 11F 2010 track.png Track map of Tropical Depression 11F of the 2009 “10 South Pacific cyclone season known as Cyclone 17P by NRL The points show the location of the storm at 6-hour intervals The colour represents the storm's maximum sustained wind speeds as classified in the Saffir-Simpson Hurricane Scale see below and the shape of the data points represent the nature of the storm according to the legend below User Nilfanion/Tc/T Created using Wikipedia WikiProject Tropical cyclones/Tracks The background image is from NASA Tracking data is from http //www nrlmry navy mil/tcdat/tc10/SHEM/17P SEVENTEEN/trackfile txt NRL 2010-02-22 Keith Edkins 2009-10 South Pacific cyclone season track maps Tropical Depression 11F 2010 | ||||