MAKE A MEME
View Large Image

| View Original: | 768-ig-van-2016-top2500-topcolour-sorted-1000-squares-01-31january2016-square-piechart.png (5376x2880) | |||
| Download: | Original | Medium | Small | Thumb |
| Courtesy of: | www.flickr.com | More Like This | ||
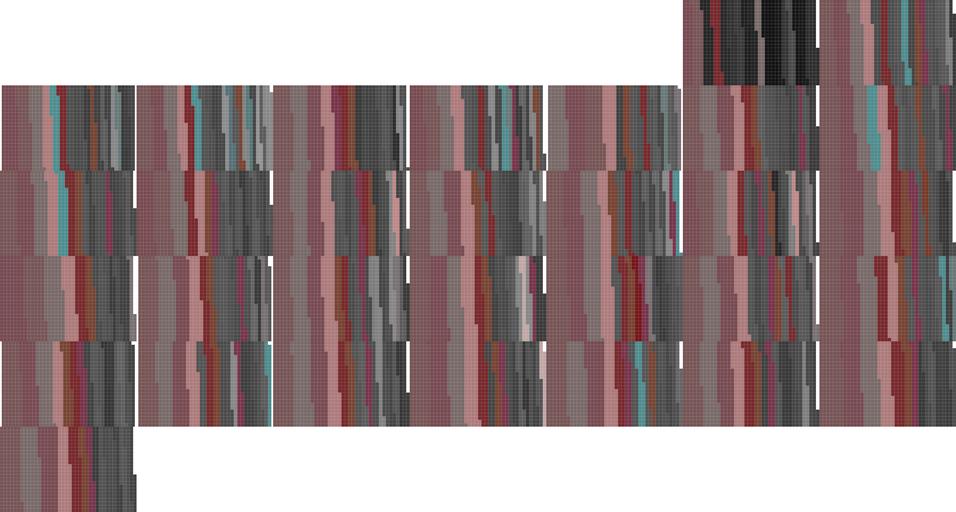
| Keywords: rolandtanglaoinfoviz infoviz rolandtanglaosquarepiechart squarepiechart instagram vancouver instagramvancouver instagram vancouver 2016 instagramvancouver2016 instagram vancouver january 2016 instagramvancouverjanuary2016 vancouver rolandtanglaoinfographic infographic top1000 first2500 ig photos from january 1-31, 2016 top colour: Algorithm: take 1st 2500 photos, get colournames, sort by descending frequency of colournames and then take the first 1000 photos to form a graph of &lt;=1000 squares (code: github.com/rtanglao/2016-r-rtgram scroll down to August 31, 2016 and &quot;Cumulative sum 1000&quot;) ig photos from january 1-31, 2016 top colour: Algorithm: take 1st 2500 photos, get colournames, sort by descending frequency of colournames and then take the first 1000 photos to form a graph of <=1000 squares (code: github.com/rtanglao/2016-r-rtgram scroll down to August 31, 2016 and "Cumulative sum 1000") | ||||