MAKE A MEME
View Large Image
| View Original: | Changes in total solar irradiance and monthly sunspot numbers, 1975-2013.png (2318x1746) | |||
| Download: | Original | Medium | Small | Thumb |
| Courtesy of: | commons.wikimedia.org | More Like This | ||
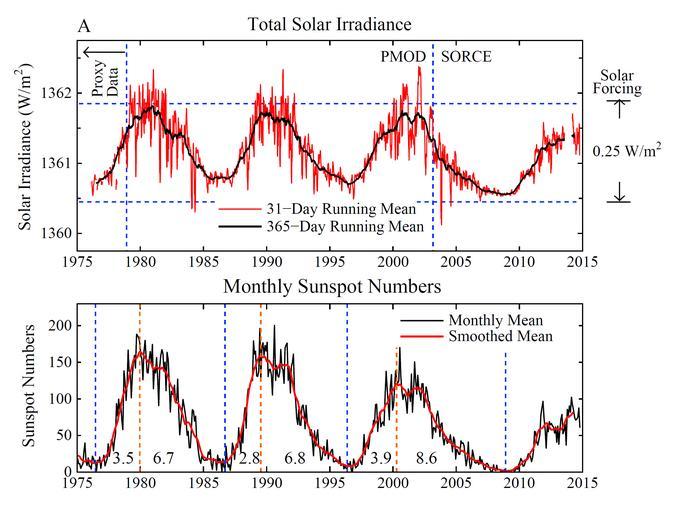
| Keywords: Changes in total solar irradiance and monthly sunspot numbers, 1975-2013.png total solar irradiance TSI labelled A and monthly sunspot numbers B between approximately 1975 to 2013 TSI is measured in watts per square metre W m<sup>-2</sup> with 31-day and 365-day running means plotted The 31-day mean shows more variability than the 365-day mean Both curves show a pattern of peaks and troughs see solar cycle The range of changes in solar forcing 365-day mean over the time period is 0 25 W m<sup>2</sup> Graph B plots a monthly mean and smoothed mean with the monthly mean showing more variability than the smoothed mean The pattern of peaks and troughs in total solar irradiance is replicated in this graph of monthly sunspot numbers A summary of the data is given in a later section Open access Figure 7 in citation Assessing Dangerous Climate Change Required Reduction of Carbon Emissions to Protect Young People Future Generations and Nature 2013 Hansen J et al CITEREFHansenothers2013 PLoS ONE 8 12 http //www plosone org/article/info 3Adoi 2F10 1371 2Fjournal pone 0081648 10 1371/journal pone 0081648 Archived https //web archive org/web/20140814233219/http //www plos org/wp-content/uploads/2013/05/pone-8-12-hansen pdf 14 August 2014 A high-resolution version of this image is available http //www columbia edu/~mhs119/YoungPeople/ here archived http //web archive org/web/20140716062107/http //www columbia edu/~mhs119/YoungPeople/ 16 July 2014 Hansen J Kharecha P Sato M Masson-Delmotte V Ackerman F et al 2013-12-03 Data Values are approximate See Hansen et al for original data sources For TSI and monthly sunspot numbers data are given for the 365-day mean and smoothed mean respectively Values are given that correspond to peaks and troughs in the curves as well as values at the beginning and end of the time period approximately 1977 and 2014 wikitable - Year TSI - 1977 1360 75 - 1981 1361 85 - 1986 1360 75 - 1991 1361 6 - 1996 1360 75 - 2001 1361 7 - 2009 1360 55 - 2013 1361 35 wikitable - Year Sunspot No - 1977 15 - 1980 160 - 1987 15 - 1991 145 - 1997 10 - 2001 105 - 2009 3 - 2014 85 Global warming graphs Sunspots Solar activity Cc-zero ImageNote 1 457 949 79 47 2318 1746 2 21 ImageNoteEnd 1 ImageNote 2 885 949 73 49 2318 1746 2 22 ImageNoteEnd 2 ImageNote 3 1342 928 61 64 2318 1746 2 23 ImageNoteEnd 3 ImageNote 4 1904 931 52 58 2318 1746 2 24 ImageNoteEnd 4 | ||||