MAKE A MEME
View Large Image

| View Original: | Convolution Animation (Exponential and Gaussian).gif (360x222) | |||
| Download: | Original | Medium | Small | Thumb |
| Courtesy of: | commons.wikimedia.org | More Like This | ||
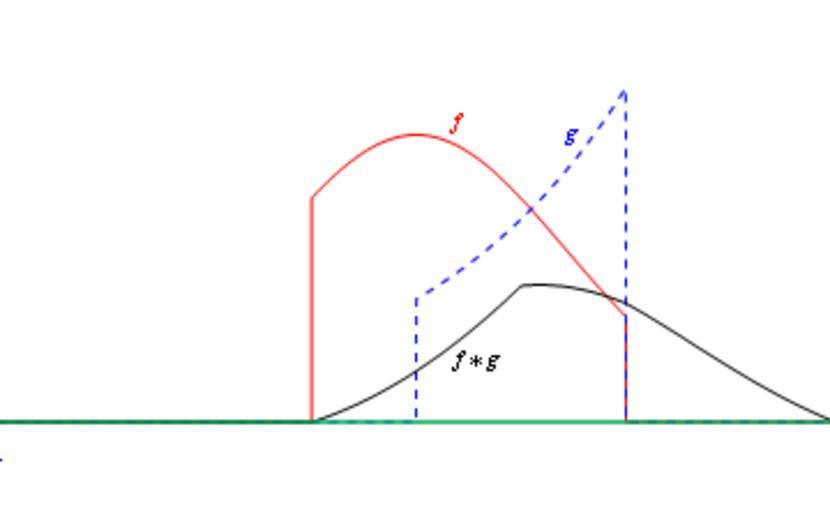
| Keywords: Convolution Animation (Exponential and Gaussian).gif en An animation of an f t an exponential function and g t a Gaussian function <math>f t \begin cases e -t 2 -0 5 \le t < 1 \\ 0 \mbox otherwise \end cases </math> <math>g t \begin cases 0 3 e t 0 \le t < 1 \\ 0 \mbox otherwise \end cases </math> where H x is the Heaviside step function Also shown is the time-reversed and shifted g ˆ’t in solid blue the product f t g ˆ’t green and the convolution h t f t ˆ— g t black equal to the area of the product at the particular own Inductiveload 2009-03-05 Mathematica Code <pre><nowiki> Function definitions ft_ Piecewise 0 t < -0 5 0 7 Exp-t 2 -0 5 < t < 1 0 t > 1 ; gt_ Piecewise 0 t < 0 0 3 Expt 0 < t < 1 0 t > 1 ; hy_ Module t Convolveft gt t y ; Parts of the drawing that only need to be computed once constplots Plot ft gt ht t -2 2 PlotStyle -> Red Blue Dashed Black ClippingStyle -> False Axes -> False Exclusions -> False ; anim TableShow The plots we generated earlier constplots Plot the time reversed gt g\Tau-t Plotg\Tau - t t -5 5 PlotPoints -> 100 ClippingStyle -> False PlotStyle -> Blue Exclusions -> False Axes -> False Plot the product of the ft and g\Tau-t Plotft g\Tau - t t -5 5 PlotPoints -> 100 ClippingStyle -> False Filling -> Axis FillingStyle -> DirectiveGreen Opacity0 2 PlotStyle -> Green Exclusions -> False Axes -> False Plot the embellishments Graphics Blue Line \Tau -0 05 \Tau 1 1 Red Textf 2 73 Background -> None Blue Textg 75 7 Background -> None Blue Text g \Tau-t \Tau - 58 4 Background -> None Green Text f t g \Tau-t \Tau - 0 55 -0 04 Background -> None Black TextStarf g 30 15 Background -> None Blue Text \Tau \Tau -0 1 Background -> White PlotRange -> -1 9 1 9 - 2 1 \Tau -2 2 025 Table index is the time delay ; ListAnimateanim </nowiki></pre> Convolution | ||||