MAKE A MEME
View Large Image

| View Original: | Exoplanet Mass-Radius Scatter Super-Earth.png (800x947) | |||
| Download: | Original | Medium | Small | Thumb |
| Courtesy of: | commons.wikimedia.org | More Like This | ||
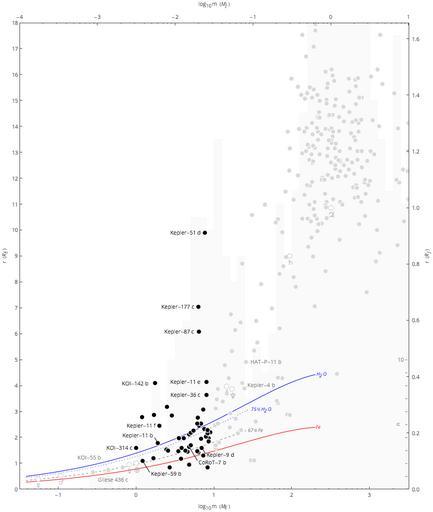
| Keywords: Exoplanet Mass-Radius Scatter Super-Earth.png black transiting Super-Earths black dots 1px solid black compared with those of white Solar System planets gray circles and 1px solid cdcdcd dadada other transiting exoplanets gray dots 1px solid dadada along with fbfbfb the distribution n light gray bar chart of minimum masses see important note below of transiting and non-transiting exoplanets 1px solid white detected through 2014-04-19 Scales indicate log<sub>10</sub> of planetary mass m expressed as Earth masses bottom and Jupiter masses top ; planetary radius r expressed in Earth radii left and Jupiter radii right ; and counts n gray ticks on right References lines are provided for approximate mass-radius relationships<ref name planetmodels > cite journal Seager S M Kuchner C A Hier-Majumder and B Militzer 2007 Mass-radius relationships for solid exoplanets The Astrophysical Journal 669 1279-1297 http //www iop org/EJ/abstract/0004-637X/669/2/1279/ 10 1086/521346 2014-04-18 </ref> for selected planetary compositions H<sub>2</sub>O - hypothetical pure water ice planet; any planet above this line has a significant H/He envelope; 1px solid blue 75 H<sub>2</sub>O + 3 Fe; 22 MgSiO<sub>3</sub> - water world; 1px dotted blue 67 Fe + 32 5 MgSiO<sub>3</sub> - rocky terrestrial; 1px dashed 808080 Fe - hypothetical pure iron planet exoplanets below this line are not likely 1px solid red Exoplanet data is from the Open Exoplanet Catalogue <ref> cite web http //www openexoplanetcatalogue com Open Exoplanet Catalogue 2014-04-19 2014-04-19 </ref> version https //github com/hannorein/open_exoplanet_catalogue/tree/4945b99b43dbd34703a66d74e1b325325c7d3d2a/systems 4945b99 The figure shows all planets up to 10 M<sub>J</sub> omitting 59 more massive planets and transiting planets up to 18 R<sub>E</sub> omitting an additional 17 with m ‰¤ 10 M<sub>J</sub> but r > 18 R<sub>E</sub> PSR B1257+12 b with m < 10<sup>-4</sup> M<sub>J</sub> lies off to the left of the graph and is also omitted Important note This figure is intended to serve as a catalog of generally accepted candidate exoplanets using the distribution of some of their basic properties related to detection No attempt has been made to characterize the degree of confidence which varies widely in the existence of a given planet or its properties Nor is any attempt made to convey systematic errors associated with a particular method In particular the indicated mass m for an exoplanet characterized using radial velocity is the minimum mass so that the actual distribution of masses for non-transiting planets may be shifted and smeared significantly to the right <references/> Own User Aldaron/Credit false true 2014-04-25 Related graphs <gallery> File Exoplanet_Discovery_Methods_Bar png Exoplanet discoveries by year; color-coded by discovery method File Exoplanet Period-Mass Scatter png Scatter plot of exoplanet period and mass data; color-coded by discovery method </gallery> Astronomy plots Astronomy cluster diagrams Astrobiology Language-neutral diagrams Exoplanet diagrams Scatterplots Super-Earths | ||||