MAKE A MEME
View Large Image

| View Original: | Fin unemployment 90 06.png (816x576) | |||
| Download: | Original | Medium | Small | Thumb |
| Courtesy of: | commons.wikimedia.org | More Like This | ||
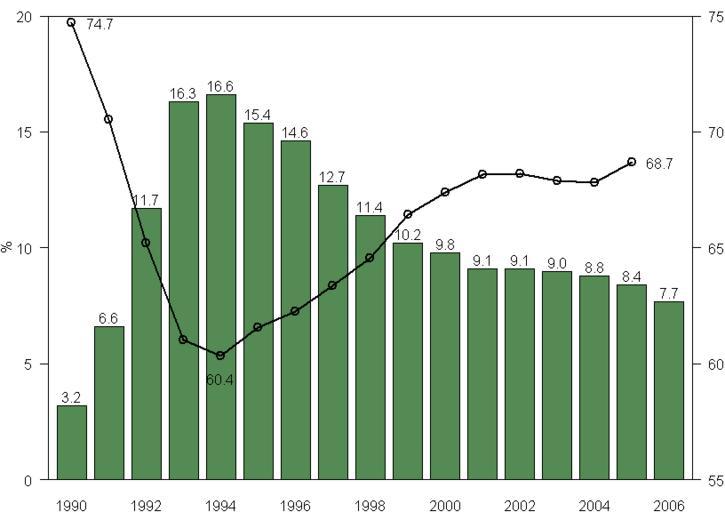
| Keywords: Fin unemployment 90 06.png Finnish unemployment rate left axis bars and employment rate right axis line between 1990 and 2006 Labour Force Survey Suomen työttömyysaste vasen asteikko pylväät ja työllisyysaste oikea viiva vuosina 1990 - 2006 työvoimatutkimus Data from http //www mol fi/mol/fi/99_pdf/fi/06_tyoministerio/06_julkaisut/aikakausi/tak/2006/00/Taulukot pdf Ministry of Labour Työpoliittinen aikakauskirja tables graph own work 2007-03-06 Jkv PD-Own R source u <- c 3 2 6 6 11 7 16 3 16 6 15 4 14 6 12 7 11 4 10 2 9 8 9 1 9 1 9 0 8 8 8 4 7 7 p <-c 3737 3761 3784 3802 3825 3839 3850 3862 3878 3890 3901 3909 3918 3926 3935 3948 -c 385 394 401 409 422 430 434 437 437 435 436 437 439 442 447 452 e <- c 2504 2375 2206 2071 2054 2099 2127 2170 2222 2296 2335 2367 2372 2365 2365 2401 png fin_unemployment_90_06 png width 480 1 7 height 480 1 2 par mar c 2 3 1 2 las 1 mgp c 2 2 1 0 x <- barplot u names arg 1990 2006 col palegreen4 space 3 ylim c 0 20 ylab xaxs r xlim c 8 21 6 text x u+ 4 format u T lines x-17 100 e/p-55 lwd 2 points x-17 100 e/p-55 lwd 2 cex 1 5 pch 1 axis 4 seq 0 20 5 seq 55 75 5 text c x1+1 x5 x16+1 c 100 e/p-55 c 1 5 16 +c 0 -1 0 format c 100 e/p c 1 5 16 T di 3 box dev off Created with R Unemployment in Finland Economy of Finland | ||||