MAKE A MEME
View Large Image

| View Original: | Gamma abs2.png (966x544) | |||
| Download: | Original | Medium | Small | Thumb |
| Courtesy of: | commons.wikimedia.org | More Like This | ||
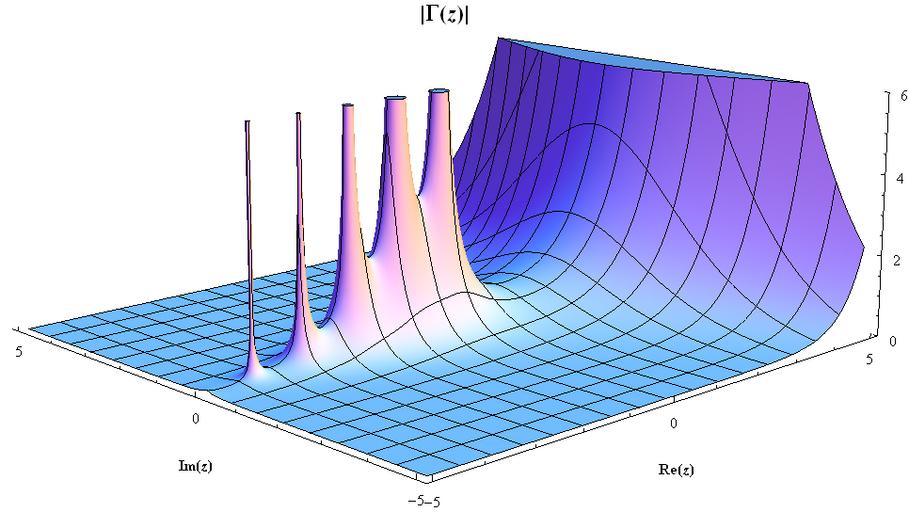
| Keywords: Gamma abs2.png Created using Mathematica Plot3DAbsGammax + I y x -4 9 5 y -5 5 PlotRange -> 0 6 PlotPoints -> 100 LabelStyle -> Directive16 PlotLabel -> StyleAbsGammaz 24 Bold AxesLabel -> StyleRez Bold StyleImz Bold Boxed -> False 2007-09-29 own assumed Vanished user fijtji34toksdcknqrjn54yoimascj Surface plots of complex gamma and related functions Images with Mathematica source code | ||||