MAKE A MEME
View Large Image
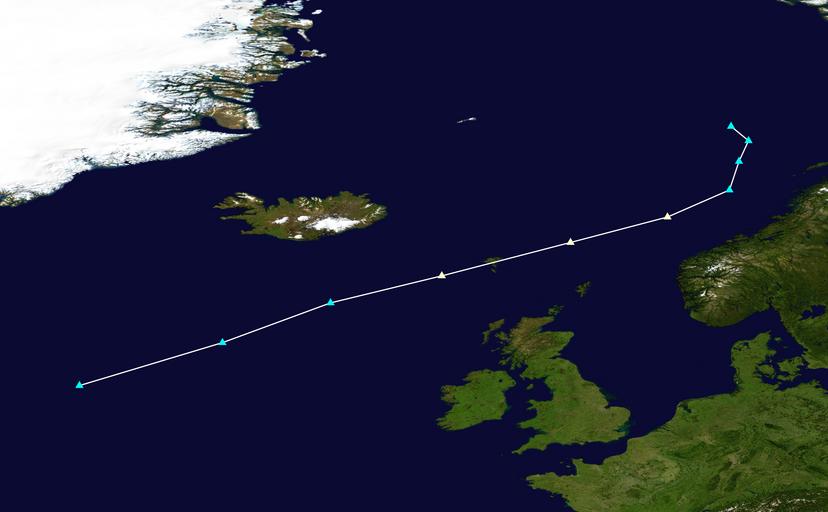
| View Original: | Gertrude 2016 track.png (2700x1669) | |||
| Download: | Original | Medium | Small | Thumb |
| Courtesy of: | commons.wikimedia.org | More Like This | ||
| Keywords: Gertrude 2016 track.png Track map of Storm Gertrude of the w European windstorms of 2015 The points show the location of the storm at 6-hour intervals The colour represents the storm's maximum sustained wind speeds as classified in the Beaufort wind scale see below WPETC track map/Table Created by Supportstorm using Wikipedia WikiProject Tropical cyclones/Tracks The background image is from NASA Tracking data is from NOAA OPC 2016-01-30 Supportstorm Track map generator input code AL072016 GERTRUDE 10 20160128 1200 EX 54 3N 32 9W 55 987 0 0 0 0 0 0 0 0 0 0 0 0 20160128 1800 EX 57 0N 23 9W 55 978 0 0 0 0 0 0 0 0 0 0 0 0 20160129 0000 EX 59 5N 17 1W 60 964 0 0 0 0 0 0 0 0 0 0 0 0 20160129 0600 EX 61 2N 10 1W 65 953 0 0 0 0 0 0 0 0 0 0 0 0 20160129 1200 EX 63 3N 2 0W 70 949 0 0 0 0 0 0 0 0 0 0 0 0 20160129 1800 EX 64 9N 4 1E 65 949 0 0 0 0 0 0 0 0 0 0 0 0 20160130 0000 EX 66 6N 8 0E 60 950 0 0 0 0 0 0 0 0 0 0 0 0 20160130 0600 EX 68 4N 8 6E 55 953 0 0 0 0 0 0 0 0 0 0 0 0 20160130 1200 EX 69 7N 9 2E 50 952 0 0 0 0 0 0 0 0 0 0 0 0 20160130 1800 EX 70 6N 8 1E 45 953 0 0 0 0 0 0 0 0 0 0 0 0 bash div Collapse bottom European windstorms of 2015 track maps Storm Gertrude 2016 | ||||