MAKE A MEME
View Large Image

| View Original: | Golden function.svg (600x500) | |||
| Download: | Original | Medium | Small | Thumb |
| Courtesy of: | commons.wikimedia.org | More Like This | ||
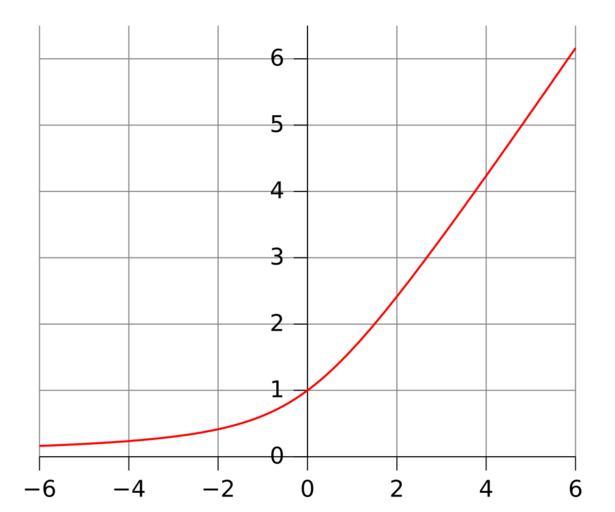
| Keywords: Golden function.svg en Graph of the Golden Function between x -6 and x +6 Own Qef 2008-07-02 Created to replace similar bitmap graph http //en wikipedia org/wiki/Image Goldenfunc PNG Source code Created with gnuplot using the following input file <pre> set terminal svg font Bitstream Vera Sans 18 size 600 500 set output Golden_function svg set xrange -6 6 set yrange 0 6 5 set xzeroaxis linetype -1 set yzeroaxis linetype -1 set xtics axis nomirror offset 0 0 3 set ytics axis nomirror offset -0 8 set key off set grid set border 0 set samples 400 plot x+sqrt x 2+4 /2 with line linetype rgbcolor red linewidth 2 </pre> The output SVG was filtered with the following command to change the hyphens to proper minus signs <pre>sed -i 's/<text>-/<text>\xE2\x88\x92/g' Golden_function svg</pre> Qef Hyperbola rational function Images with Gnuplot source code | ||||