MAKE A MEME
View Large Image

| View Original: | Layout engine usage share.svg (646x376) | |||
| Download: | Original | Medium | Small | Thumb |
| Courtesy of: | commons.wikimedia.org | More Like This | ||
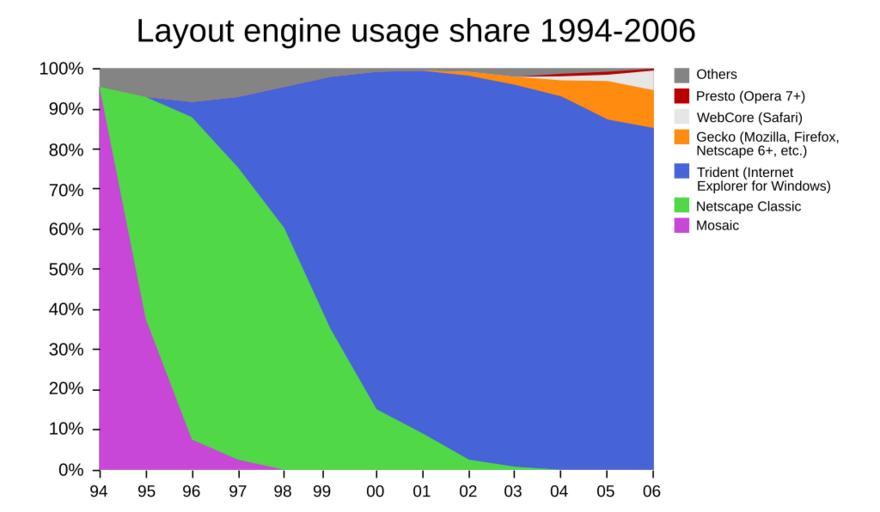
| Keywords: Layout engine usage share.svg Comparison of layout engine/web browser usage share market share over time Data is based on usage share of web browsers Note that the values may contain errors Existing problems in the current data Data for the early part of the first browser wars could use some refinement Extremely scant data prior to 1996 No statistical data prior to 1994 possible to infer certain things though Very few statistics about Safari and no data about Konqueror Please help improving the data if you can - Suggestions for future improvements Include partial-year data points see following suggestions rather than the rough way of doing it like now Start of the graph WorldWideWeb the world's first web browser was completed on Christmas Day 1990 and was released to the public by way of Internet newsgroups in August 1991 Mosaic was released on April 22 1993 ; as per usage share of web browsers by January 1994 it was at 97 so a very rapid replacement Beta versions of Netscape Navigator were freely downloadable in mid- to late-1994 and version 1 0 of the browser was released by the end of the year If we had some 1995 data that would help fill in the blanks but by October 1994 as per the usage share of web browsers page again the usage share for NN was already 18 the internet pioneers were certainly early adopters ne ; and by 1996 was well in the majority Microsoft licensed Spyglass Enhanced Mosaic as the basis of Internet Explorer 1 0 which it released as part of the Microsoft Windows 95 Plus Pack in August 1995 Internet Explorer 2 0 was released three months later and by then the race was on Internet Explorer was not widely used until version 4 which was released in October 1997 Present data in such a way that the year marker indicates data for January 1 of that year e g reading up from 2005 should indicate approximate market share for Jan 1 2005 If you have a better chart drawing tool please create a better one Original Graph created with OpenOffice org Calc Recreated in vector form in Inkscape The revised CSV data <div style height 18 1em; overflow auto; > <syntaxhighlight lang bash enclose pre > Date Mosaic Netscape Classic Trident Internet Explorer for Windows Gecko Mozilla Firefox Netscape 6+ etc WebKit Safari Presto Opera 7+ Others 1994 95 0 0 0 0 0 5 1995 37 5 55 0 0 0 0 7 5 1996 7 5 80 3 75 0 0 0 8 75 1997 2 5 72 5 17 5 0 0 0 7 5 1998 0 60 35 0 0 0 5 1999 0 35 62 5 0 0 0 2 5 2000 0 15 83 75 0 0 0 1 25 2001 0 9 90 0 0 0 1 2002 0 2 5 95 25 1 0 0 1 25 2003 0 0 75 94 75 2 0 0 2 5 2004 0 0 92 625 4 1 0 625 1 75 2005 0 0 86 903861 9 544639 1 571667 0 7429 1 23693299999999 2006 0 0 60 65 9 5925 30 995 0 4825 0 4825</syntaxhighlight></div> Some further notes on the data Because these especially the very early data are rough estimates we should see nice round numbers or at least numbers that make the graph pretty ; WorldWideWeb currently has only 0 values for data points; I am thus excluding it from the CSV info and graph barring new information The data for each year should add up to 100 percent According to the Mosaic page Mosaic's popularity as a separate browser began to dry up upon the release of Netscape Navigator and by 1998 its userbase had almost completely evaporated which means it should have non-zero values up until then In January 2003 Opera 7 was released and introduced a new layout engine Presto Thus for our graph the 2003 value Jan 1 for Opera Presto should be zero; changed accordingly Since Netscape Browser uses IE/Moz dual engine unless it is used more widely which is quite less likely to happen we should exclude it to avoid the confusion the contribution from Netscape 8 right now <1 would be less than the difference ~3 between the various sources reporting Firefox's share 8- Please overwrite this image instead of creating a new one when you update the information derivative works Layout engine usage share-2009-01-07 svg Area charts of web browser statistics | ||||