MAKE A MEME
View Large Image

| View Original: | LynnHarveyNyborg-Atheism-IQ.svg (864x576) | |||
| Download: | Original | Medium | Small | Thumb |
| Courtesy of: | commons.wikimedia.org | More Like This | ||
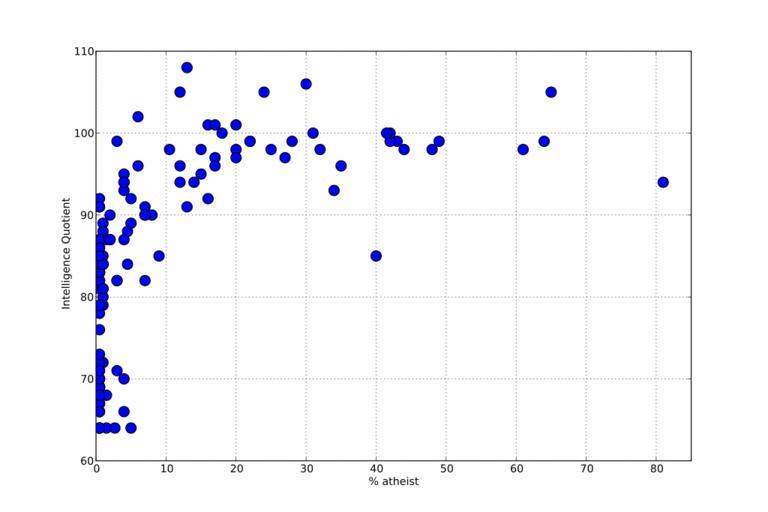
| Keywords: LynnHarveyNyborg-Atheism-IQ.svg en This is a graph created by myself using data from Appendix A in the paper Average intelligence predicts atheism rates across 137 nations by Richard Lynn John Harvey Helmuth Nyborg published in the journal Intelligence It is derived from https //en wikipedia org/wiki/File LynnHarveyNyborg-CountryBelieveGod-Intelligence svg and simplifies some labels The data were plotted using the following Python script <source lang python > /usr/bin/env python from pylab import rc 'font' family 'sans-serif' rc 'figure' figsize 12 8 seriesBelief 0 5 8 0 0 5 1 5 4 0 14 0 25 0 18 0 0 5 0 5 17 0 43 0 0 5 1 0 0 5 1 0 0 5 34 0 0 5 0 5 7 0 0 5 22 0 1 5 0 5 2 0 12 0 1 0 2 7 1 0 0 5 7 0 40 0 61 0 48 0 7 0 1 0 0 5 1 0 49 0 0 5 28 0 44 0 0 5 4 0 42 0 0 5 16 0 1 0 0 5 0 5 1 0 32 0 16 0 3 0 1 5 4 5 0 5 5 0 15 0 6 0 3 0 65 0 0 5 12 0 0 5 0 5 7 0 5 0 20 0 3 0 0 5 0 5 13 0 0 5 0 5 0 5 0 5 0 5 4 5 6 0 20 0 0 5 5 0 4 0 0 5 42 0 22 0 1 0 0 5 0 5 31 0 0 5 0 5 1 0 1 0 1 0 0 5 3 0 4 0 4 0 27 0 0 5 0 5 0 5 0 5 13 0 17 0 35 0 0 5 1 0 30 0 15 0 0 5 64 0 17 0 0 5 24 0 2 0 0 5 0 5 0 5 9 0 0 5 2 0 0 5 20 0 0 5 41 5 10 5 12 0 4 0 1 0 81 0 0 5 0 5 300 0 seriesIQ 84 90 83 68 93 94 98 100 87 82 97 99 70 87 70 87 91 93 68 69 91 64 99 64 68 90 105 84 64 89 69 90 85 98 98 82 88 81 80 99 64 99 98 66 94 99 71 92 79 67 67 81 98 101 82 87 84 87 92 95 102 71 105 84 94 72 86 90 89 98 82 67 83 91 82 69 92 69 76 88 96 101 84 64 70 78 100 99 81 69 69 100 83 84 84 84 85 86 99 95 94 97 70 84 66 64 108 96 96 68 72 106 98 79 99 101 83 105 87 72 91 70 85 83 87 73 97 84 100 98 96 87 84 94 85 71 100 scatter seriesBelief seriesIQ 137 ; xlabel ' athesim' ylabel 'Intelligence Quotient' axis 0 85 60 110 grid True savefig 'LynnHarveyNyborg-CountryBelieveGod-Intelligence svg' </source> 2013-06-04 07 28 06 own Smk65536 Created with Matplotlib cc-zero Uploaded with UploadWizard Intelligence Religion and science Images with Python source code | ||||