MAKE A MEME
View Large Image

| View Original: | Matt Prior test batting career v2.png (1136x525) | |||
| Download: | Original | Medium | Small | Thumb |
| Courtesy of: | commons.wikimedia.org | More Like This | ||
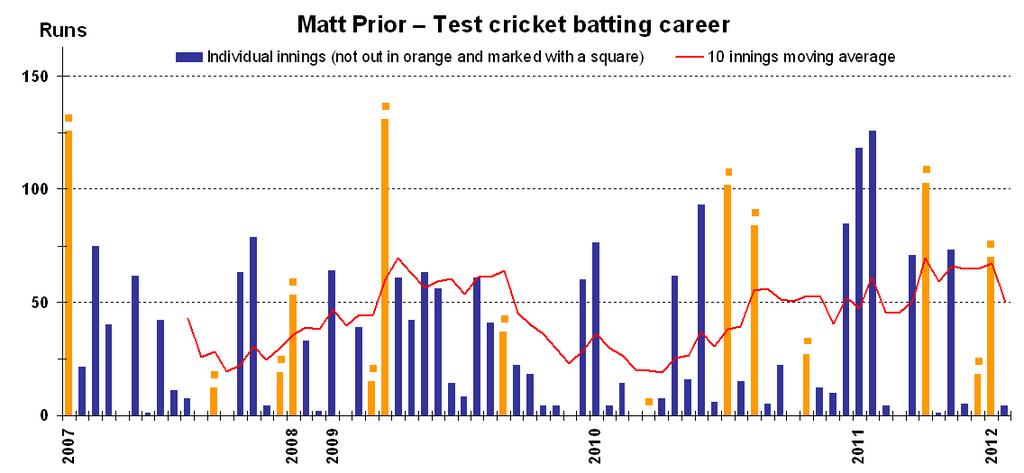
| Keywords: Matt Prior test batting career v2.png This graph details the test match performance of cricketer w Matt Prior and was created by en wiki w user EdChem Each bar indicates a single test match innings blue ones for innings in which he was dismissed orange ones marked with a square for innings in which he batted but was not out The red line shows the 10 innings moving average as at the end of each innings An alternative version w File Matt Prior test batting career v1 png instead shows his career batting average <p>The graph was generated with Microsoft Excel 2003 the resulting chart being copied to Adobe Photoshop 9 and saved in png format using data from w Cricinfo http //stats espncricinfo com/stats/engine/player/18675 html class 1;template results;type batting;view innings and w Howstat http //www howstat com au/cricket/Statistics/Players/PlayerProgressBat asp PlayerID 3239 This version is current as at 22 January 2012 which is also the date it was prepared en wikipedia FastilyClone MTC EdChem w other versions EdChem wikipedia en Cc-zero Original upload log page en wikipedia Matt+Prior+test+batting+career+v2 png wikitable - 2012-01-22 13 21 48 1136× 525× EdChem This graph details the test match performance of cricketer Matt Prior and was created by en wiki user EdChem Each bar indicates a single test match innings blue ones for innings in which he was dismissed orange ones marked wit - Uncategorized 2016 July 24 | ||||