MAKE A MEME
View Large Image

| View Original: | Median_and_Average_Sales_Prices_of_New_Homes_Sold_in_United_States_1963-2008_annual.png (921x438) | |||
| Download: | Original | Medium | Small | Thumb |
| Courtesy of: | commons.wikimedia.org | More Like This | ||
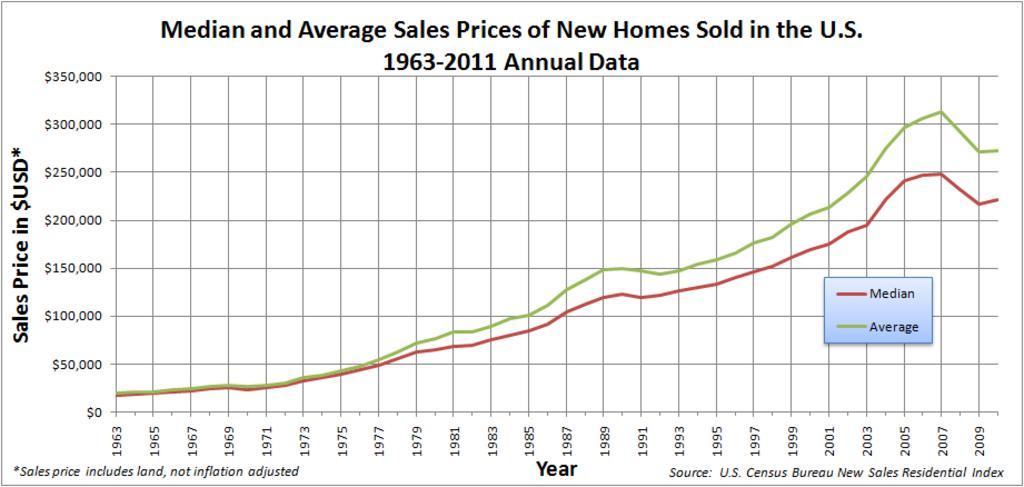
| Keywords: Median and Average Sales Prices of New Homes Sold in United States 1963-2008 annual.png SVG en A graph showing the Median and Average Sales Prices of New Homes Sold in United States It shows the annual data from 1963 through 2008 It should be noted that the sales price includes the land This graph is made using the data from http //www census gov/const/uspriceann pdf The graph was made in excel http //www census gov/const/uspriceann pdf http //www mediafire com/ 7si89zm84plx3 Excel file 00 42 4 January 2010 UTC United States Census Bureau Public Domain File Median and Average Sales Prices of New Homes Sold in United States 1963-2008 annual pdf<br> File Median_and_Average_Sales_Prices_of_New_Homes_Sold_in_United_States_1963-2008 png for the monthly version The data is as follows center style background f0f0f0; Year center style background f0f0f0; Median center style background f0f0f0; Average - 1963 18 000 19 300 - 1964 18 900 20 500 - 1965 20 000 21 500 - 1966 21 400 23 300 - 1967 22 700 24 600 - 1968 24 700 26 600 - 1969 25 600 27 900 - 1970 23 400 26 600 - 1971 25 200 28 300 - 1972 27 600 30 500 - 1973 32 500 35 500 - 1974 35 900 38 900 - 1975 39 300 42 600 - 1976 44 200 48 000 - 1977 48 800 54 200 - 1978 55 700 62 500 - 1979 62 900 71 800 - 1980 64 600 76 400 - 1981 68 900 83 000 - 1982 69 300 83 900 - 1983 75 300 89 800 - 1984 79 900 97 600 - 1985 84 300 100 800 - 1986 92 000 111 900 - 1987 104 500 127 200 - 1988 112 500 138 300 - 1989 120 000 148 800 - 1990 122 900 149 800 - 1991 120 000 147 200 - 1992 121 500 144 100 - 1993 126 500 147 700 - 1994 130 000 154 500 - 1995 133 900 158 700 - 1996 140 000 166 400 - 1997 146 000 176 200 - 1998 152 500 181 900 - 1999 161 000 195 600 - 2000 169 000 207 000 - 2001 175 200 213 200 - 2002 187 600 228 700 - 2003 195 000 246 300 - 2004 221 000 274 500 - 2005 240 900 297 000 - 2006 246 500 305 900 - 2007 247 900 313 600 - 2008 232 100 292 600 - 2009 216 700 270 900 - 2010 221 800 272 900 PD-USGov Original upload log en wikipedia FtCG page en wikipedia Median_and_Average_Sales_Prices_of_New_Homes_Sold_in_United_States_1963-2008_annual png wikitable Date/Time Dimensions User Comment - 14 43 12 October 2011 921 × 438 37 120 bytes Smallman12q w en <nowiki> Updated </nowiki> - 01 07 4 January 2010 1 421 × 720 9 554 bytes Smallman12q w en <nowiki> Changed Costs to sales price </nowiki> - 00 42 4 January 2010 1 421 × 720 9 449 bytes Smallman12q w en <nowiki> A graph showing the Median and Average Sales Prices of New Homes Sold in United States It shows the annual data from 1963 through 2008 It should be noted that the sales price includes the land This graph is made using </nowiki> Diagrams in English Housing in the United States | ||||