MAKE A MEME
View Large Image

| View Original: | Nose Cone Haack Series.svg (1500x1000) | |||
| Download: | Original | Medium | Small | Thumb |
| Courtesy of: | commons.wikimedia.org | More Like This | ||
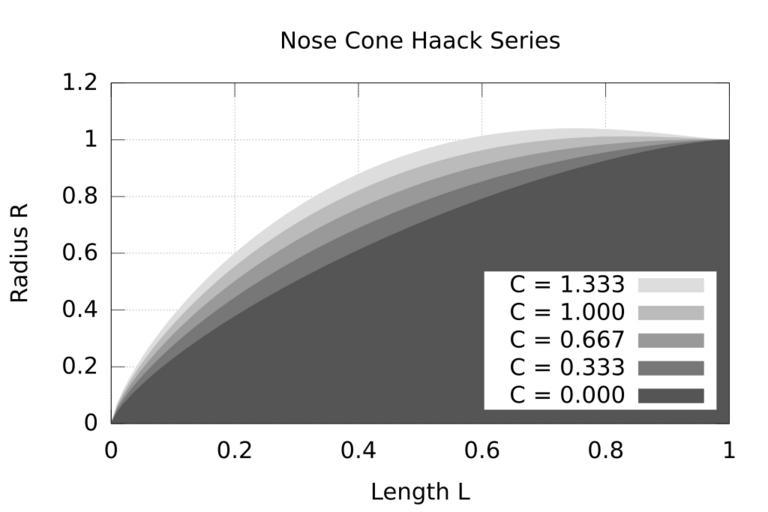
| Keywords: Nose Cone Haack Series.svg Uploaded with en wp UW marker 2013 12 27 A series of curves layered to illustrate different values for C in the formula given under Nose Cone Design Haack series Note that this diagramme has arbitrary width and height and will not necessarily show Length and Radius at a practical ratio It should there fore not be understood as showing cross-section contours of actual nose cones only as an illustration of different values used in the describing formula Created with Gnuplot using the Haack series formula and a selection of input values for C relevant to the article Values are 0 0 333 0 667 1 and 1 333 2013-12-27 Andersenman cc-zero Uncategorized 2013 December 27 | ||||