MAKE A MEME
View Large Image

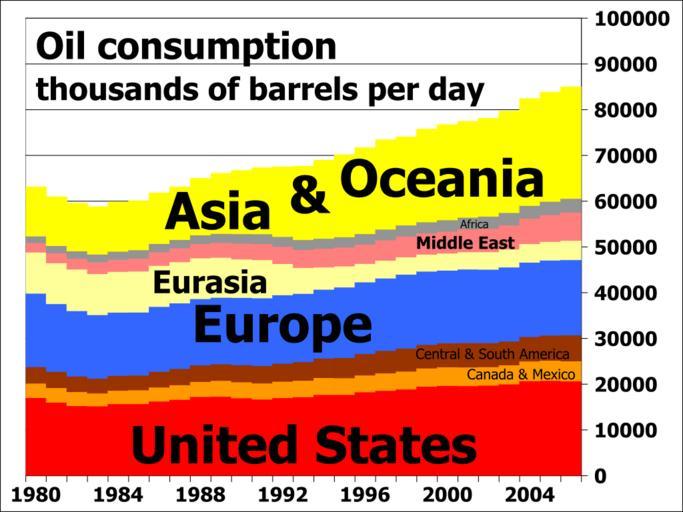
| View Original: | Oil consumption per day by region from 1980 to 2006.svg (480x360) | |||
| Download: | Original | Medium | Small | Thumb |
| Courtesy of: | commons.wikimedia.org | More Like This | ||
| Keywords: Oil consumption per day by region from 1980 to 2006.svg See also thumb left same data but charted as a proportion of the total thumb center same proportional chart but with vertical lines clr 84user Area charts Economic trends XY plots Petroleum statistics | ||||