MAKE A MEME
View Large Image
| View Original: | Old_Towns_and_New_Needs_Fig._8_and_9.png (2322x1251) | |||
| Download: | Original | Medium | Small | Thumb |
| Courtesy of: | commons.wikimedia.org | More Like This | ||
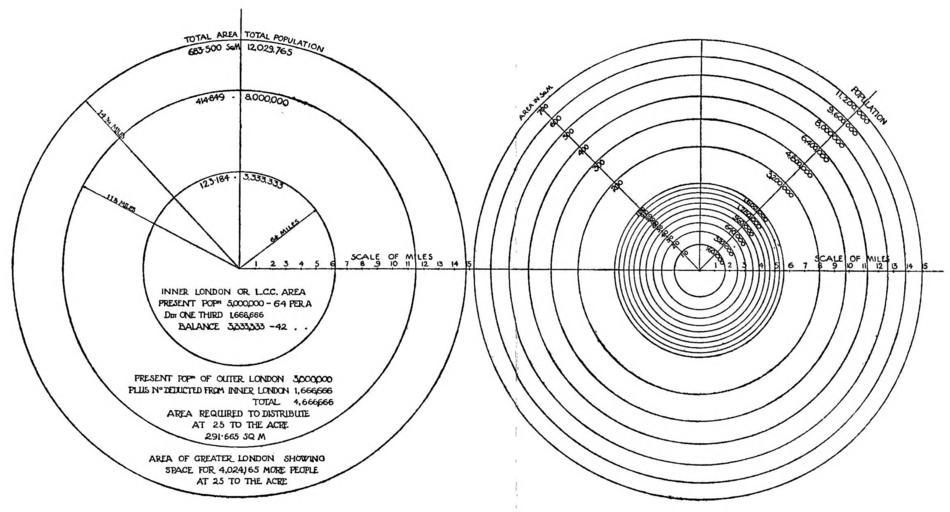
| Keywords: Old Towns and New Needs Fig. 8 and 9.png en Old Towns and New Needs book figures 8 and 9 FIG 8 ”Diagram showing how it would be possible to reduce the pressure of population in the centre of London by one-third its present inhabitants and yet find accommodation at an average of only 25 people to the acre for over 12 000 000 people within the present area of greater London and within a radius of less than 15 miles from the centre FIG 9 ”Diagram illustrating how the population which can be accommodated in a town increases much more rapidly than the average distance of the dwellings from the centre of the town In this diagram the whole of the population is assumed to average 25 people to the acre http //www archive org/stream/cu31924024423729 page/n81/mode/1up archive org creator Raymond Urwin 1912 1941 50px Old Towns and New Needs book | ||||