MAKE A MEME
View Large Image

| View Original: | Pedal line illustration.png (427x453) | |||
| Download: | Original | Medium | Small | Thumb |
| Courtesy of: | commons.wikimedia.org | More Like This | ||
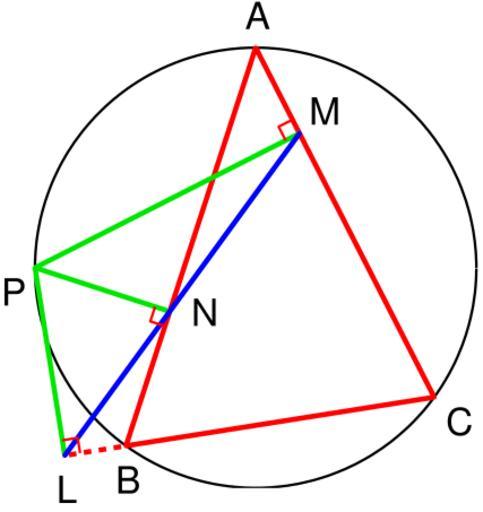
| Keywords: Pedal line illustration.png en wikipedia Maksim page en wikipedia Source code <source lang matlab > function main figure 1 ; clf; hold on; axis equal; axis off thickness 4; ball_rad 0 009; i sqrt -1 ; red 1 0 0; blue 0 0 1; black 0 0 0; green 0 0 9 0; fontsize 30; A exp i pi/2 ; B exp i 1 3 pi ; C exp i 1 8 pi ; P exp i 1 0 pi ; N return_perp A B P ; M return_perp C A P ; L return_perp B C P ; X 0 0 01 2 pi; plot cos X sin X 'color' black 'linewidth' thickness/2 ; plot circle plot sides plot real A B imag A B 'color' red 'linewidth' thickness ; plot real B C imag B C 'color' red 'linewidth' thickness ; plot real A C imag A C 'color' red 'linewidth' thickness ; line continuations plot real A M imag A M 'color' red 'linewidth' thickness 'linestyle' '--' ; plot real A N imag A N 'color' red 'linewidth' thickness 'linestyle' '--' ; plot real B N imag B N 'color' red 'linewidth' thickness 'linestyle' '--' ; plot real C L imag C L 'color' red 'linewidth' thickness 'linestyle' '--' ; plot real C M imag C M 'color' red 'linewidth' thickness 'linestyle' '--' ; plot heights plot real L P imag L P 'color' green 'linewidth' thickness ; plot real M P imag M P 'color' green 'linewidth' thickness ; plot real N P imag N P 'color' green 'linewidth' thickness ; plot pedal plot real L M imag L M 'color' blue 'linewidth' thickness ; plot real L N imag L N 'color' blue 'linewidth' thickness ; plot real M N imag M N 'color' blue 'linewidth' thickness ; ball A ball_rad red ; ball B ball_rad red ; ball C ball_rad red ; ball L ball_rad blue ; ball M ball_rad blue ; ball N ball_rad blue ; ball P ball_rad green ; ang_size 0 07; ang_thick 2; plot_angle P M A ang_size ang_thick red plot_angle P N B ang_size ang_thick red plot_angle P L C ang_size ang_thick red text_dist 0 005; place_text_smartly P fontsize 5 text_dist 'P' place_text_smartly A fontsize 2 text_dist 'A' place_text_smartly B fontsize 6 text_dist 'B' place_text_smartly C fontsize 7 text_dist 'C' place_text_smartly L fontsize 6 text_dist 'L' place_text_smartly M fontsize 1 text_dist 'M' place_text_smartly N fontsize 0 text_dist 'N' saveas gcf 'Pedal_line_illustration eps' 'psc2' function plot_angle a b c dist thickness color u b+dist a-b /abs a-b ; v b+dist c-b /abs c-b ; w u+v-b; plot real u w v imag u w v 'color' color 'linewidth' thickness ; function d return_perp a b c t fminbnd inline 'min abs sqrt -1 b-a /abs b-a - c-t b- 1-t a /abs c-t b- 1-t a abs sqrt -1 b-a /abs b-a + c-t b- 1-t a /abs c-t b- 1-t a ' 't' 'a' 'b' 'c' -0 5 2 a b c ; d t b+ 1-t a; function place_text_smartly z fs pos d tx p cos pi/4 +sqrt -1 sin pi/4 ; z z + p pos d fs; shiftx 0 0003; shifty 0 002; x real z ; y imag z ; H text x+shiftx fs y+shifty fs tx ; set H 'fontsize' fs 'HorizontalAlignment' 'c' 'VerticalAlignment' 'c' function ball z r color x real z ; y imag z ; Theta 0 0 1 2 pi; X r cos Theta +x; Y r sin Theta +y; H fill X Y color ; set H 'EdgeColor' color ; </source> 1 date/time username edit summary ---- 08 54 3 December 2005 en User Oleg Alexandrov <nowiki> update code </nowiki> ---- 05 45 3 December 2005 en User Oleg Alexandrov <nowiki> + source code </nowiki> ---- 05 45 3 December 2005 en User Oleg Alexandrov <nowiki></nowiki> Original upload log Legend cur this is the current file del delete this old version rev revert to this old version Click on date to download the file or see the image uploaded on that date del cur 08 54 3 December 2005 en User Oleg_Alexandrov Oleg Alexandrov en User_talk Oleg_Alexandrov Talk 427x453 39570 bytes Pedal element circle geometry Files by User Oleg Alexandrov from en wikipedia Images with Matlab source code math | ||||