MAKE A MEME
View Large Image

| View Original: | RiemannCriticalLine.svg (800x600) | |||
| Download: | Original | Medium | Small | Thumb |
| Courtesy of: | commons.wikimedia.org | More Like This | ||
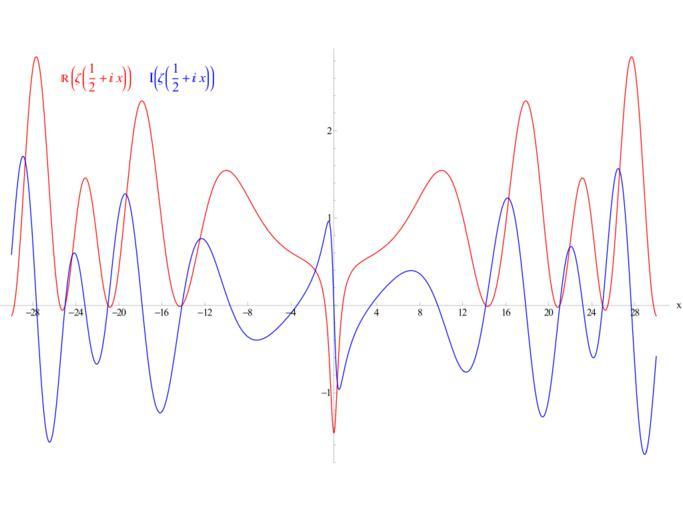
| Keywords: RiemannCriticalLine.svg validSVG en Graph of real red and imaginary blue parts of the critical line Re z 1/2 of the Riemann zeta function Own work Made with Mathematica using the following code <code><nowiki>ShowPlot ReZeta1/2+I x ImZeta1/2+I x x -30 30 AxesLabel-> x PlotStyle-> Red Blue Ticks-> Table4x-28 x 0 14 ImageSize-> 800 600 GraphicsTextStyle\DoubleStruckCapitalR\Zeta I x + 1/2 14 Red Background ->White -22 2 6 GraphicsTextStyle\GothicCapitalI\Zeta I x + 1/2 14 Blue Background ->White -14 2 6 </nowiki></code> Slonzor 20/11/08 Public Domain Riemann zeta function | ||||