MAKE A MEME
View Large Image
| View Original: | Simple set2.png (1267x1014) | |||
| Download: | Original | Medium | Small | Thumb |
| Courtesy of: | commons.wikimedia.org | More Like This | ||
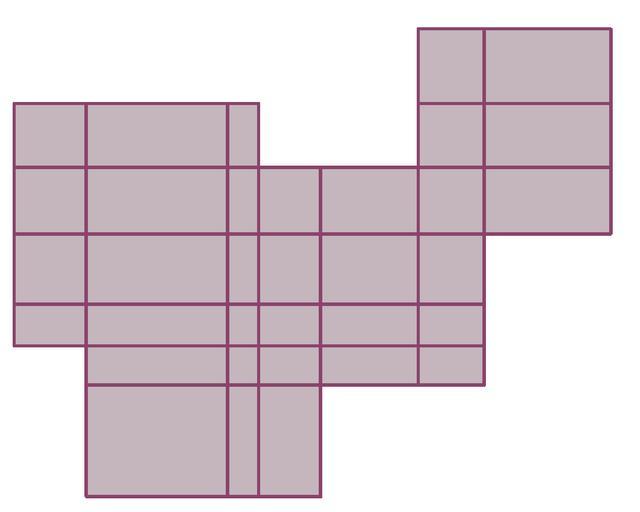
| Keywords: Simple set2.png Made by myself with matlab 2007-02-07 own assumed Oleg Alexandrov Source code MATLAB <source lang Matlab > split a union of rectangles into a union of rectangles without overlaps function main M 10; imag_root sqrt -1 ; lw 2 5; Ball_rad 0 03; figure 2 ; clf; hold on; axis equal; axis off; plot the outer polygonal curve color 139;10;80/256; X -2 3677 1 7624 0 1177 4 6499 -3 6469 0 6659 3 4803 6 8794; Y -3 1177 0 2814 -1 1440 2 6937 -0 4496 3 8268 1 5241 5 1425; a dummy plot to avoid a matlab bug causing some lines to appear too thin C 1 05; plot C min X C min Y ' ' 'color' 0 99 1 1 1 ; plot C max X C max Y ' ' 'color' 0 99 1 1 1 ; plot the big rectangles and fill their interiors n length X /2; for i 1 n ax X 2 i-1 ; bx X 2 i ; ay Y 2 i-1 ; by Y 2 i ; plot the rectangle plot ax bx bx ax ax ay ay by by ay 'linewidth' lw 'color' color ; round off the corners a cosmetic thing round_ball ax+imag_root ay Ball_rad color' ; round_ball ax+imag_root by Ball_rad color' ; round_ball bx+imag_root ay Ball_rad color' ; round_ball bx+imag_root by Ball_rad color' ; end plot the interiors all the small rectangles XS sort X ; YS sort Y ; for l 1 length XS -1 ; for m 1 length YS -1 cx XS l ; dx XS l+1 ; cy YS m ; dy YS m+1 ; success 0; don't fill a rectangle more than once will show up darker then for i 1 n ax X 2 i-1 ; bx X 2 i ; ay Y 2 i-1 ; by Y 2 i ; if ax < cx dx < bx ay < cy dy < by success 0 success 1; fill cx dx dx cx cy cy dy dy color'/2 'FaceAlpha' 0 3 'linewidth' 0 01 'EdgeAlpha' 0 ; end end end end plot the edges of all rectanges for i 1 n ax X 2 i-1 ; bx X 2 i ; ay Y 2 i-1 ; by Y 2 i ; for l 1 length XS ; u XS l ; if ax < u u < bx plot u u ay by 'linewidth' lw 'color' color ; end end for l 1 length YS ; v YS l ; if ay < v v < by plot ax bx v v 'linewidth' lw 'color' color ; end end end saveas gcf 'simple_set2 eps' 'psc2' ; function round_ball z r color x real z ; y imag z ; Theta 0 0 1 2 pi; X r cos Theta +x; Y r sin Theta +y; Handle fill X Y color ; set Handle 'EdgeColor' color ; </source> Measure theory Images with Matlab source code Files by User Oleg Alexandrov from en wikipedia math | ||||