MAKE A MEME
View Large Image
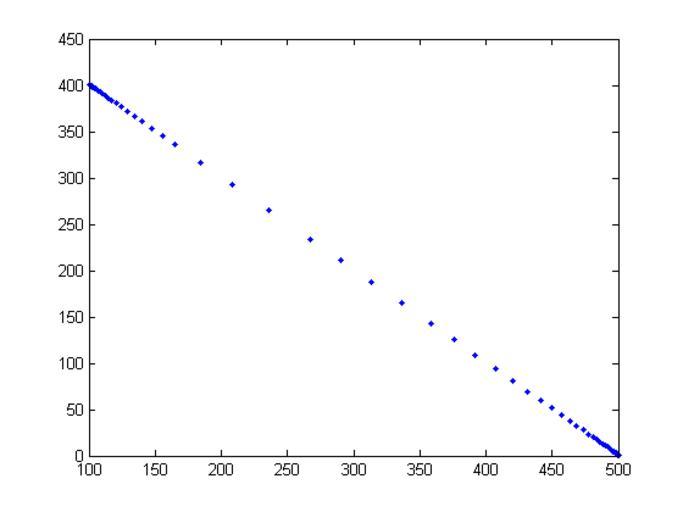
| View Original: | StatespaceSI-SIS.png (560x420) | |||
| Download: | Original | Medium | Small | Thumb |
| Courtesy of: | commons.wikimedia.org | More Like This | ||
| Keywords: StatespaceSI-SIS.png An epidemiological graph for the SIS model Statespace for S I S represents the number of susceptibles I the number of infectious people Graph generated using MATLAB code 2006-06-19 own assumed Bye~commonswiki sirsys m program <pre> P 60 N 500 options odeset 'RelTol' 1e-4 'AbsTol' 1e-4 ; beta 0 001; v 0 1; T Y ode45 sissys1 0 P N 1 options beta v ; plot T Y 1 T Y 2 ; plot T Y 1 ' ' T Y 2 ' ' ; </pre> sissys1 m function <pre> function dy sirsys1 t y beta v dy zeros 2 1 ; a column vector dy 1 - beta y 1 y 2 +v y 2 ; dy 2 beta y 1 y 2 -v y 2 ; end </pre> See also Image StatespaceSI-p9 png Epidemics | ||||