MAKE A MEME
View Large Image

| View Original: | Thiel-Sen estimator.svg (2936x3074) | |||
| Download: | Original | Medium | Small | Thumb |
| Courtesy of: | commons.wikimedia.org | More Like This | ||
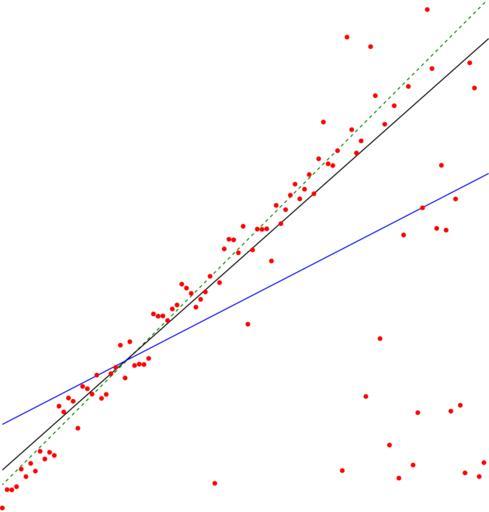
| Keywords: Thiel-Sen estimator.svg en The en Theil ôSen estimator black line of a set of sample points compared to the simple linear regression line blue The points were generated by adding a small amount of jitter to points on the green dashed line and then replacing some of the points by random outliers own David Eppstein 2011-07-03 Scatterplots Regression analysis Files by User David Eppstein from en wikipedia Images with Python source code Cc-zero Source code This image was created as a pdf file by the following Python code then converted to SVG <source lang python > from pyx import canvas path color from random import random seed seed 12345 N 103 noise 10 slope 1 0 def sample x y x slope if random < y/N 3 y random N outlier else y + random -0 5 noise non-outlier jitter return y samples i 1 0 sample i for i in range N c canvas canvas for x y in samples c fill path circle x y 0 5 color rgb red def theilsen samples N len samples def slope i j xi yi samplesi xj yj samplesj return yi-yj / xi-xj def median L L sort if len L 1 return Llen L //2 else return Llen L //2 - 1 + Llen L //2 /2 0 m median slope i j for i in range N for j in range i def error i x y samplesi return y - m x b median error i for i in range N return m b m b 1 0 c stroke path line 0 b N N m+b color rgb green m b theilsen samples c stroke path line 0 b N N m+b color rgb black def slr samples N len samples sumxy sum x y for x y in samples sumx sum x for x y in samples sumy sum y for x y in samples sumxx sum x x for x y in samples m sumxy - sumx sumy/N / sumxx - sumx 2/N b sumy/N - m sumx/N return m b m b slr samples c stroke path line 0 b N N m+b color rgb blue c writePDFfile ThielSen </source> | ||||