MAKE A MEME
View Large Image
| View Original: | Trace operator illustration.png (660x1842) | |||
| Download: | Original | Medium | Small | Thumb |
| Courtesy of: | commons.wikimedia.org | More Like This | ||
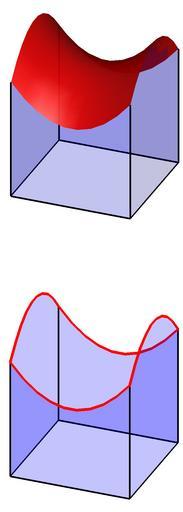
| Keywords: Trace operator illustration.png A function defined on a rectangle top figure in red and its trace bottom figure in red self-made with Matlab Oleg Alexandrov Created with MATLAB Source code MATLAB <source lang matlab > illustration of the trace operator function main L 5; box size N 10; number of points in a lot of places lw 2; width of lines alpha 0 23; transparency blue 0 0 1; red 1 0 0; black 0 0 0; the function whose surface we will plot f inline '10- x 2-y 2 /8' 'x' 'y' ; XX linspace -L L N ; YY XX; X Y meshgrid XX YY ; Z f X Y ; the surface of the side XS XX 0 XX+L invert_vector XX 0 XX-L; YS 0 XX-L YY 0 XX+L invert_vector YY ; XS XS' XS; YS YS' YS; ZS 0 XS; ZS 2 f XS 2 YS 2 ; the contour of the bottom XD -L L L -L -L; YD -L -L L L -L; ZD XD 0; prepare figure 1 for plotting figure 1 ; clf; hold on; axis equal; axis off; phi -68; theta 28; view phi theta ; plot the function u surf X Y Z 'FaceColor' red 'EdgeColor' 'none' 'FaceAlpha' 0 95 ; surf XS YS ZS 'FaceColor' blue 'EdgeColor' 'none' 'FaceAlpha' alpha ; camlight headlight; lighting phong; make nice lightning contour of the bottom and the sides plot3 XD YD ZD 'color' black 'linewidth' lw ; for i 1 length XD plot3 XD i XD i YD i YD i 0 f XD i YD i 'color' black 'linewidth' lw ; end prepare figure 2 for plotting figure 2 ; clf; hold on; axis equal; axis off; view phi theta ; plot the sides surf XS YS ZS 'FaceColor' blue 'EdgeColor' 'none' 'FaceAlpha' alpha ; contour of the bottom and the sides plot3 XD YD ZD 'color' black 'linewidth' lw ; for i 1 length XD plot3 XD i XD i YD i YD i 0 f XD i YD i 'color' black 'linewidth' lw ; end plot the restriction of u plot3 XS 2 YS 2 ZS 2 'linewidth' 2 lw 'color' red ; camlight headlight; lighting phong; make nice lightning figure 1 ; print '-dpng' '-r200' 'Trace1 png' save to file figure 2 ; print '-dpng' '-r200' 'Trace2 png' save to file function Z invert_vector X N length X ; Z X; for i 1 N Z i X N-i+1 ; end </source> Images with Matlab source code Partial differential equations Files by User Oleg Alexandrov from en wikipedia math | ||||