MAKE A MEME
View Large Image
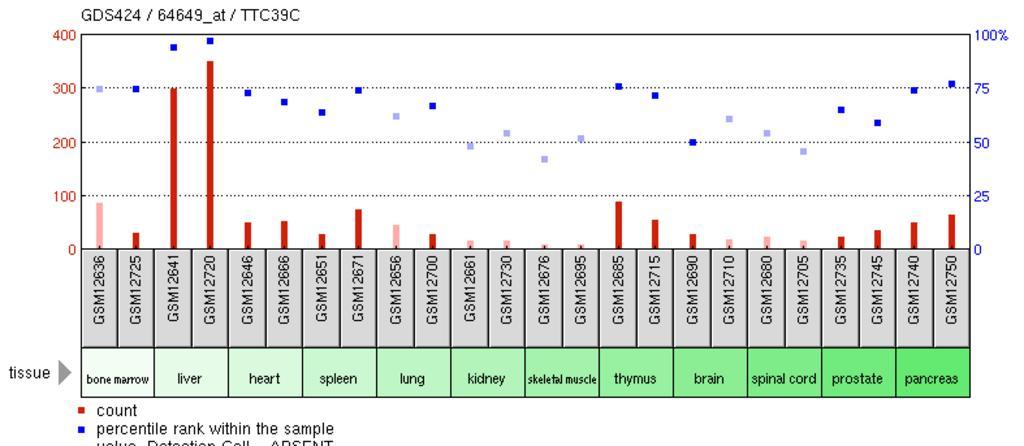
| View Original: | TTC39C_expression_in_samples_of_various_human_tissues.png (787x343) | |||
| Download: | Original | Medium | Small | Thumb |
| Courtesy of: | commons.wikimedia.org | More Like This | ||
| Keywords: TTC39C expression in samples of various human tissues.png Uploaded with en wp UW marker 2013 05 04 This is a graph of TTC39C expression in samples from different human tissues The bars indicate the quantity of TTC39C in the sample and the dots represent the percentile rank of TTC39C within each sample http //www ncbi nlm nih gov/geo/tools/profileGraph cgi ID GDS424 64649_at 2012-06-21 Affymetrix Inc PD-USGov Uncategorized 2013 May 4 | ||||