MAKE A MEME
View Large Image
| View Original: | Typical CSTR RTD curve.svg (500x400) | |||
| Download: | Original | Medium | Small | Thumb |
| Courtesy of: | commons.wikimedia.org | More Like This | ||
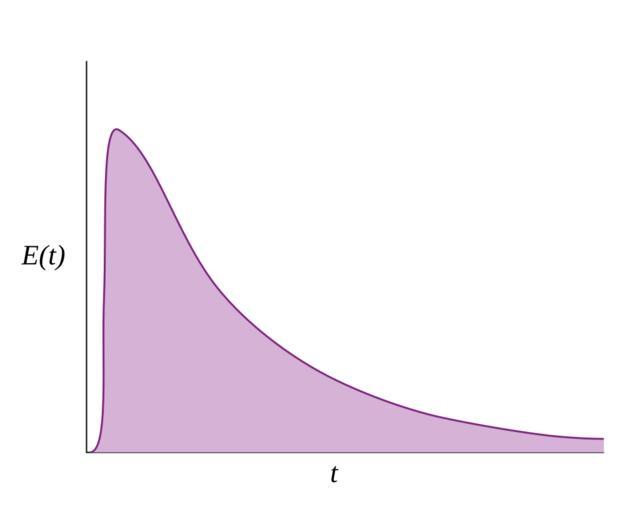
| Keywords: Typical CSTR RTD curve.svg A typical residence time distribution RTD curve that would be produced by a pulse experiment on a mixed-flow CSTR reactor The shape is approximately exponential but there is an initial lag due to the reality of physical mixing vs an ideal CSTR self-made in Inkscape 2007-09-19 Andrew Hawryluk Hawryluka Chemical reactors Continuous stirred-tank reactors | ||||