MAKE A MEME
View Large Image
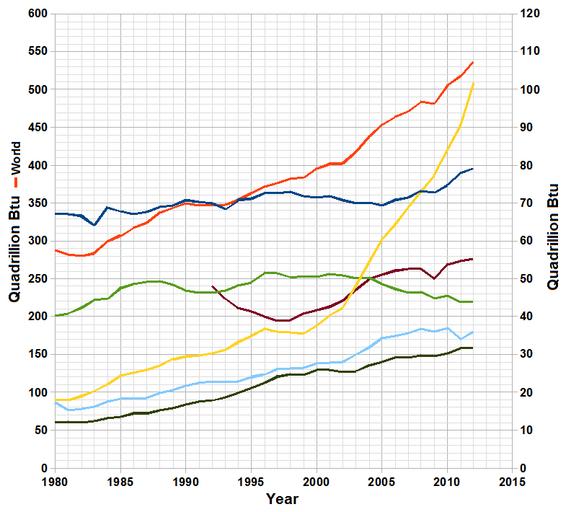
| View Original: | World total primary energy production chart only.png (785x710) | |||
| Download: | Original | Medium | Small | Thumb |
| Courtesy of: | commons.wikimedia.org | More Like This | ||
| Keywords: World total primary energy production chart only.png quadrillion Btu Note world total on left y-axis while regional figures are shonw on right y-axis approx figures in parenthesis for 2010 and 2011 respectively legend ff420e 1px solid f2f2f2 World 510 ffd320 1px solid f2f2f2 China 97 004586 1px solid f2f2f2 United States 78 7e0021 1px solid f2f2f2 Russia 56 579d1c 1px solid f2f2f2 Europe 45 83caff 1px solid f2f2f2 Africa 37 314004 1px solid f2f2f2 Central and South America 30 2014-10-16 05 55 30 U S Energy Information Administration EIA http //www eia gov/cfapps/ipdbproject/IEDIndex3 cfm tid 44 pid 44 aid 1 website eia gov Delphi234 thumb left 300px Original version with title and legend by User Delphi234 Delphi234 Energy production trends | ||||