MAKE A MEME
View Large Image

| View Original: | WT GASP on chip.jpg (3851x4269) | |||
| Download: | Original | Medium | Small | Thumb |
| Courtesy of: | commons.wikimedia.org | More Like This | ||
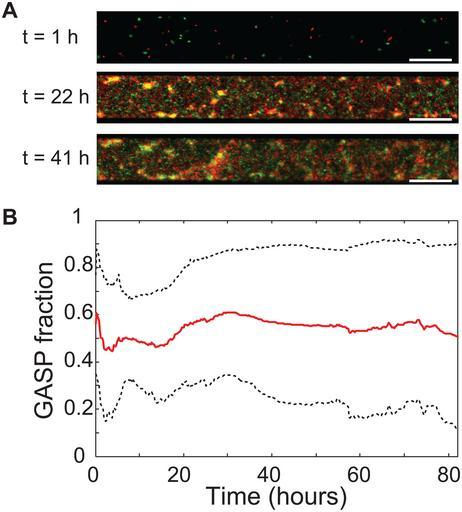
| Keywords: WT GASP on chip.jpg en WT and GASP E coli coexist in a single-patch habitat a Microscopy pictures showing a section of a habitat consisting of a single patch 8500×100×15 micrometer at three time-points the white bar indicates 50 micrometer WT green and GASP red cells develop into a structured community Initially t 1 hour planktonic cells colonize the habitat a day later many multi-cellular aggregates have formed The composition of these aggregates indicated by their color changes over time b GASP fraction through time of microhabitats consisting of a single patch with a volume equal to the total volume of an 85-patch microhabitat Mean of experiments red solid line black dashed lines indicate the mean the standard deviation doi 10 1371/journal pone 0077042 g005 2014-01-27 23 59 52 http //www plosone org/article/info 3Adoi 2F10 1371 2Fjournal pone 0077042 Felix J H Hol Peter Galajda Krisztina Nagy Rutger G Woolthuis Cees Dekker Juan Keymer cc-zero Uploaded with UploadWizard Uncategorized 2014 January 28 | ||||